Day 15 in the #vDM30in30
As I discussed previously, I have been working on getting a Vagrant stack to demonstrate how JMX metrics from puppetserver look.
And I succeeded! (kind of…)
How it works
The main bit is here:
puppet_enterprise::profile::master::java_args:
  Xmx: '2048m'
  Xms: '2048m'
  'Dcom.sun.management.jmxremote.port': '=1099'
  'Dcom.sun.management.jmxremote.authenticate': '=false'
  'Dcom.sun.management.jmxremote.ssl': '=false'
This is hiera config, that sets Puppet Enterprise’s specific Puppet code to configure puppetserver JAVA_ARGS, which will start the JMX service on 1099.
From there, we can configure a generic profile to setup jmxtrans on the Puppet master machine:
# Class: profile::metrics::jmxtrans
#
# Include base requirements for metrics collection with jmxtrans.
#
class profile::metrics::jmxtrans {
  include ::java

  case $facts['os']['family'] {
    'RedHat': {
      $package_name = 'jmxtrans'
      $service_name = 'jmxtrans'
    }
    default: {
      fail("profile::metrics::jmxtrans does not support OS '${facts['os']['name']}'")
    }
  }

  class { '::jmxtrans':
    package_name        => $package_name,
    service_name        => $service_name,
    package_source      => 'http://central.maven.org/maven2/org/jmxtrans/jmxtrans/254/jmxtrans-254.rpm',
    manage_service_file => true,
  }

  contain ::jmxtrans
}
So now we have the jmxmetrics package installed and running, but no specific config.
We need to actually configure it to grab certain metrics and point it to the other server.
We can break this down into two profiles:
- Generic Java information (heap size etc.)
- Puppetserver specific information (compile time, active puppe agent requests, JRuby information)
For the generic information, we can make a defined type. This allows us to reuse this other Java apps if we needed to in the future:
# Defined type: profile::metrics::jmxtrans::jvmcore
#
# Configure core JVM metrics shipping with jmxtrans.
#
define profile::metrics::jmx::jvmcore (
  String[1] $host,
  Integer $port,
  String[1] $graphite_host = 'graphite.example.com',
) {

  $graphite = {
    host => $graphite_host,
    port => 2003,
    root => "jmxtrans.${facts['hostname']}",
  }

  $queries = [
    {
      object       => 'java.lang:type=ClassLoading',
      attributes   => ['LoadedClassCount', 'TotalLoadedClassCount', 'UnloadedClassCount'],
      result_alias => 'lang.ClassLoading',
    },
    {
      object       => 'java.lang:type=GarbageCollector,*',
      type_names   => ['name'],
      attributes   => ['LastGcInfo'],
      result_alias => 'lang.GarbageCollector',
    },
    {
      object       => 'java.lang:type=Memory',
      attributes   => ['HeapMemoryUsage', 'NonHeapMemoryUsage'],
      result_alias => 'lang.Memory',
    },
    {
      object       => 'java.lang:type=Runtime',
      attributes   => ['Uptime'],
      result_alias => 'lang.Runtime',
    },
    {
      object       => 'java.lang:type=Threading',
      attributes   => ['ThreadCount', 'TotalStartedThreadCount', 'PeakThreadCount'],
      result_alias => 'lang.Threading',
    },
  ]

  jmxtrans::query { "${title}.java":
    host     => $host,
    port     => $port,
    graphite => $graphite,
    queries  => $queries,
  }
}
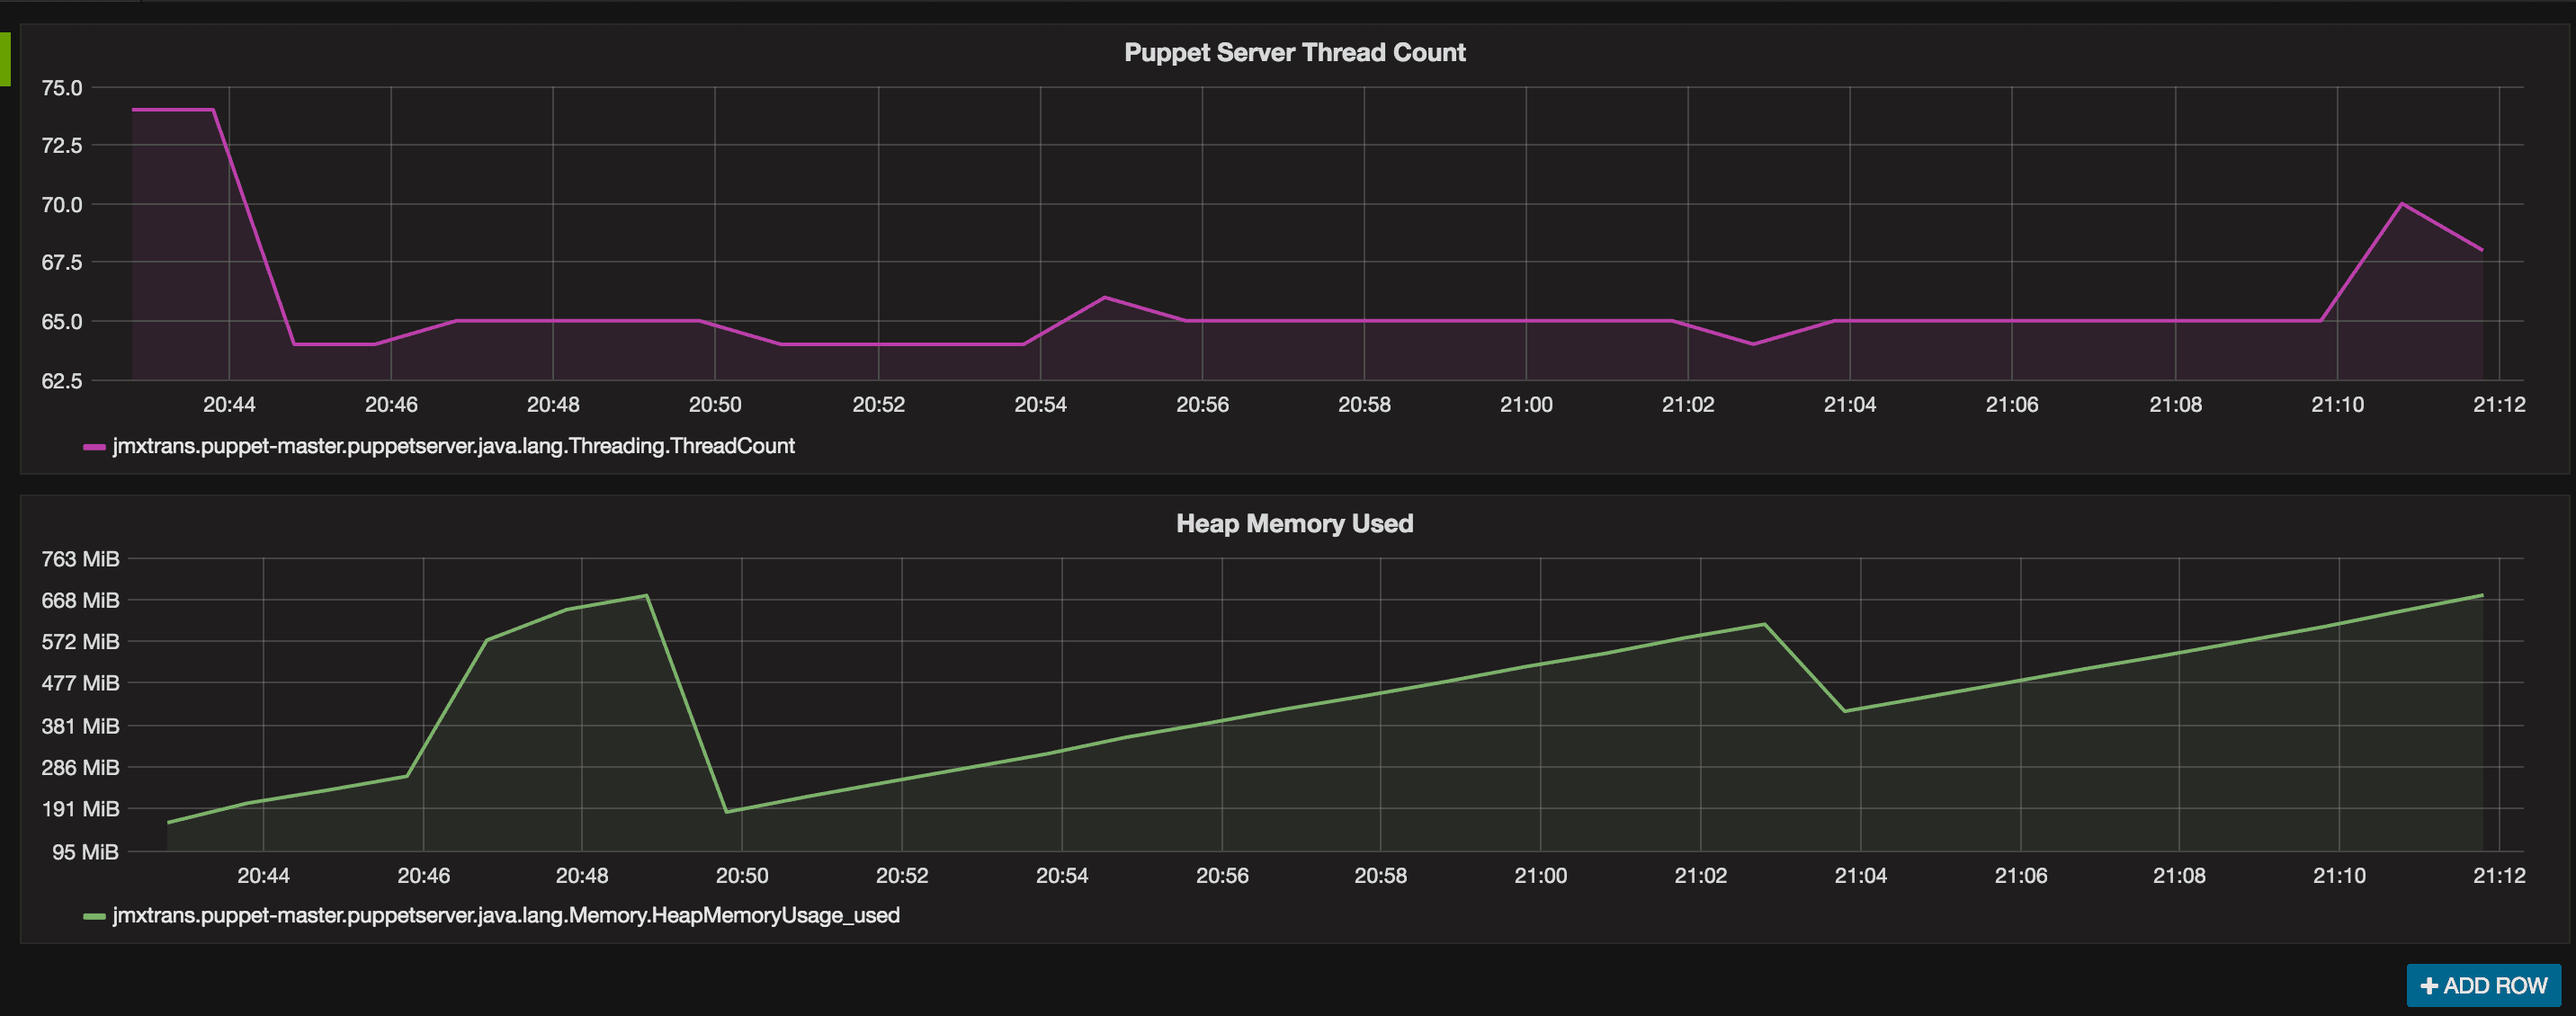
We let that setup and stew for a bit, and when complete, we should have the data in Grafana.
It should look something like this:

In the mean-time, if you’re interested, a full Vagrant stack with it in action is available here:
