Day 10 in the #vDM30in30
One thing that often comes up is customers or people in Slack/IRC asking “How do I setup X?” I often end up making basic Vagrant stack, as all the examples on Github are either too out of date or broken.
I try and pin as many dependencies as possible, and make it as easy as possible to deploy, usually doing all the work with a vagrant up.
With that in mind, I picked up an a module after someone asked about a pretty common use-case example of setting up Collectd, Graphite and Grafana for systems tracking.
It’s been a long time since I last setup Graphite, but I remembered how most of it fit together.
I made a basic Vagrant box, and did some basic bootstrapping to get Puppet and the modules I wanted installed with r10k:
  # Install Ruby
  config.vm.provision "shell", inline: <<-SHELL
    curl -s https://packagecloud.io/install/repositories/petems/ruby2/script.rpm.sh | sudo bash
    yum install -y ruby
  SHELL

  # Use r10k to download modules
  config.vm.provision "shell", inline: <<-SHELL
    yum install -y epel-release git
    gem install r10k --no-ri --no-rdoc
    cd /vagrant/ && r10k puppetfile install -v
  SHELL

  config.vm.provision "shell", inline: <<-SHELL
    curl -s https://raw.githubusercontent.com/petems/puppet-install-shell/master/install_puppet_agent.sh | sudo bash
  SHELL

end
Then ran Puppet as a vagrant provisioner:
# Use Vagrant provisioner to run puppet
  config.vm.provision :puppet do |puppet|
    puppet.environment_path = "environments"
    puppet.environment = "vagrant"
    # puppet.options = "--verbose --debug" # Uncomment for debugging
  end
And finally did some basic poking at the server to make some metrics:
- Download a file to move the network stats a bit
- Run stress to create some node to make the load graph a bit more interesting
config.vm.provision "shell", inline: <<-SHELL
    echo "Simulating some load to make the graphs more interesting";
    curl -s https://packagecloud.io/install/repositories/petems/stress/script.rpm.sh | sudo bash;
    yum install -y stress;
    stress --cpu 1 --timeout 60;
    echo "Download file to create network traffic";
    wget http://ipv4.download.thinkbroadband.com/50MB.zip --quiet;
  SHELL
Finally, output a helpful message to get Grafana working:
  config.vm.provision "shell", inline: <<-SHELL
    service iptables stop || service firewalld stop;
    echo "Grafana is running at http://192.168.10.50:3000";
    echo "Username and password: admin:admin";
  SHELL
Using the most approved and popular Graphite, Grafana and Collectd modules from the Forge, I managed to get a pretty basic setup going:
  class { '::collectd':
    package_ensure => '5.6.0',
    typesdb        => [
      '/usr/share/collectd/types.db',
    ],
    require        => Class['::epel'],
  }

  class { '::collectd::plugin::logfile':
    log_level => 'debug',
    log_file  => '/var/log/collected.log',
  }

  if $ipaddress_enp0s8 {
    $interfaces_to_monitor = ['enp0s8','enp0s3']
  } else {
    $interfaces_to_monitor = ['eth0']
  }

  class { '::collectd::plugin::interface':
    interfaces     => $interfaces_to_monitor,
    ignoreselected => false,
  }

  class { '::collectd::plugin::load':
  }

  collectd::plugin::write_graphite::carbon {'my_graphite':
    graphitehost   => 'grafana-graphite-stack-puppet-profile.vm',
    graphiteport   => '2003',
    graphiteprefix => '',
    protocol       => 'tcp',
  }
Most of this is fairly self-explanatory: configure collectd to monitor load, send that information to the graphite port on 2003.
For interfaces, because of the new naming scheme for networks in systemd I did some basic facter checking so it can chose the correct interface to monitor.
Graphite I just setup with the defaults from the module:
class profiles::graphite {

  file { '/usr/bin/pip-python':
    ensure => 'link',
    target => '/usr/bin/pip',
  } ->
  class { '::graphite':
    gr_web_cors_allow_from_all => true,
  }

}
Grafana is pretty interesting because it actually has native types and providers to create Dashboards from JSON files, so I could actually set that up:
class profiles::grafana {

  class { '::grafana':
    version => '3.0.1',
  }
  ->
  grafana_datasource { 'Graphite':
    ensure           => present,
    type             => 'graphite',
    url              => 'http://127.0.0.1:80',
    access_mode      => 'proxy',
    is_default       => true,
    grafana_url      => 'http://127.0.0.1:3000',
    grafana_user     => 'admin',
    grafana_password => 'admin',
  }
  ->
  grafana_dashboard { 'CollectD Stats from Graphite':
    ensure           => present,
    grafana_url      => 'http://127.0.0.1:3000',
    grafana_user     => 'admin',
    grafana_password => 'admin',
    content          => template('profiles/grafana_dashboard.json.erb'),
  }

}
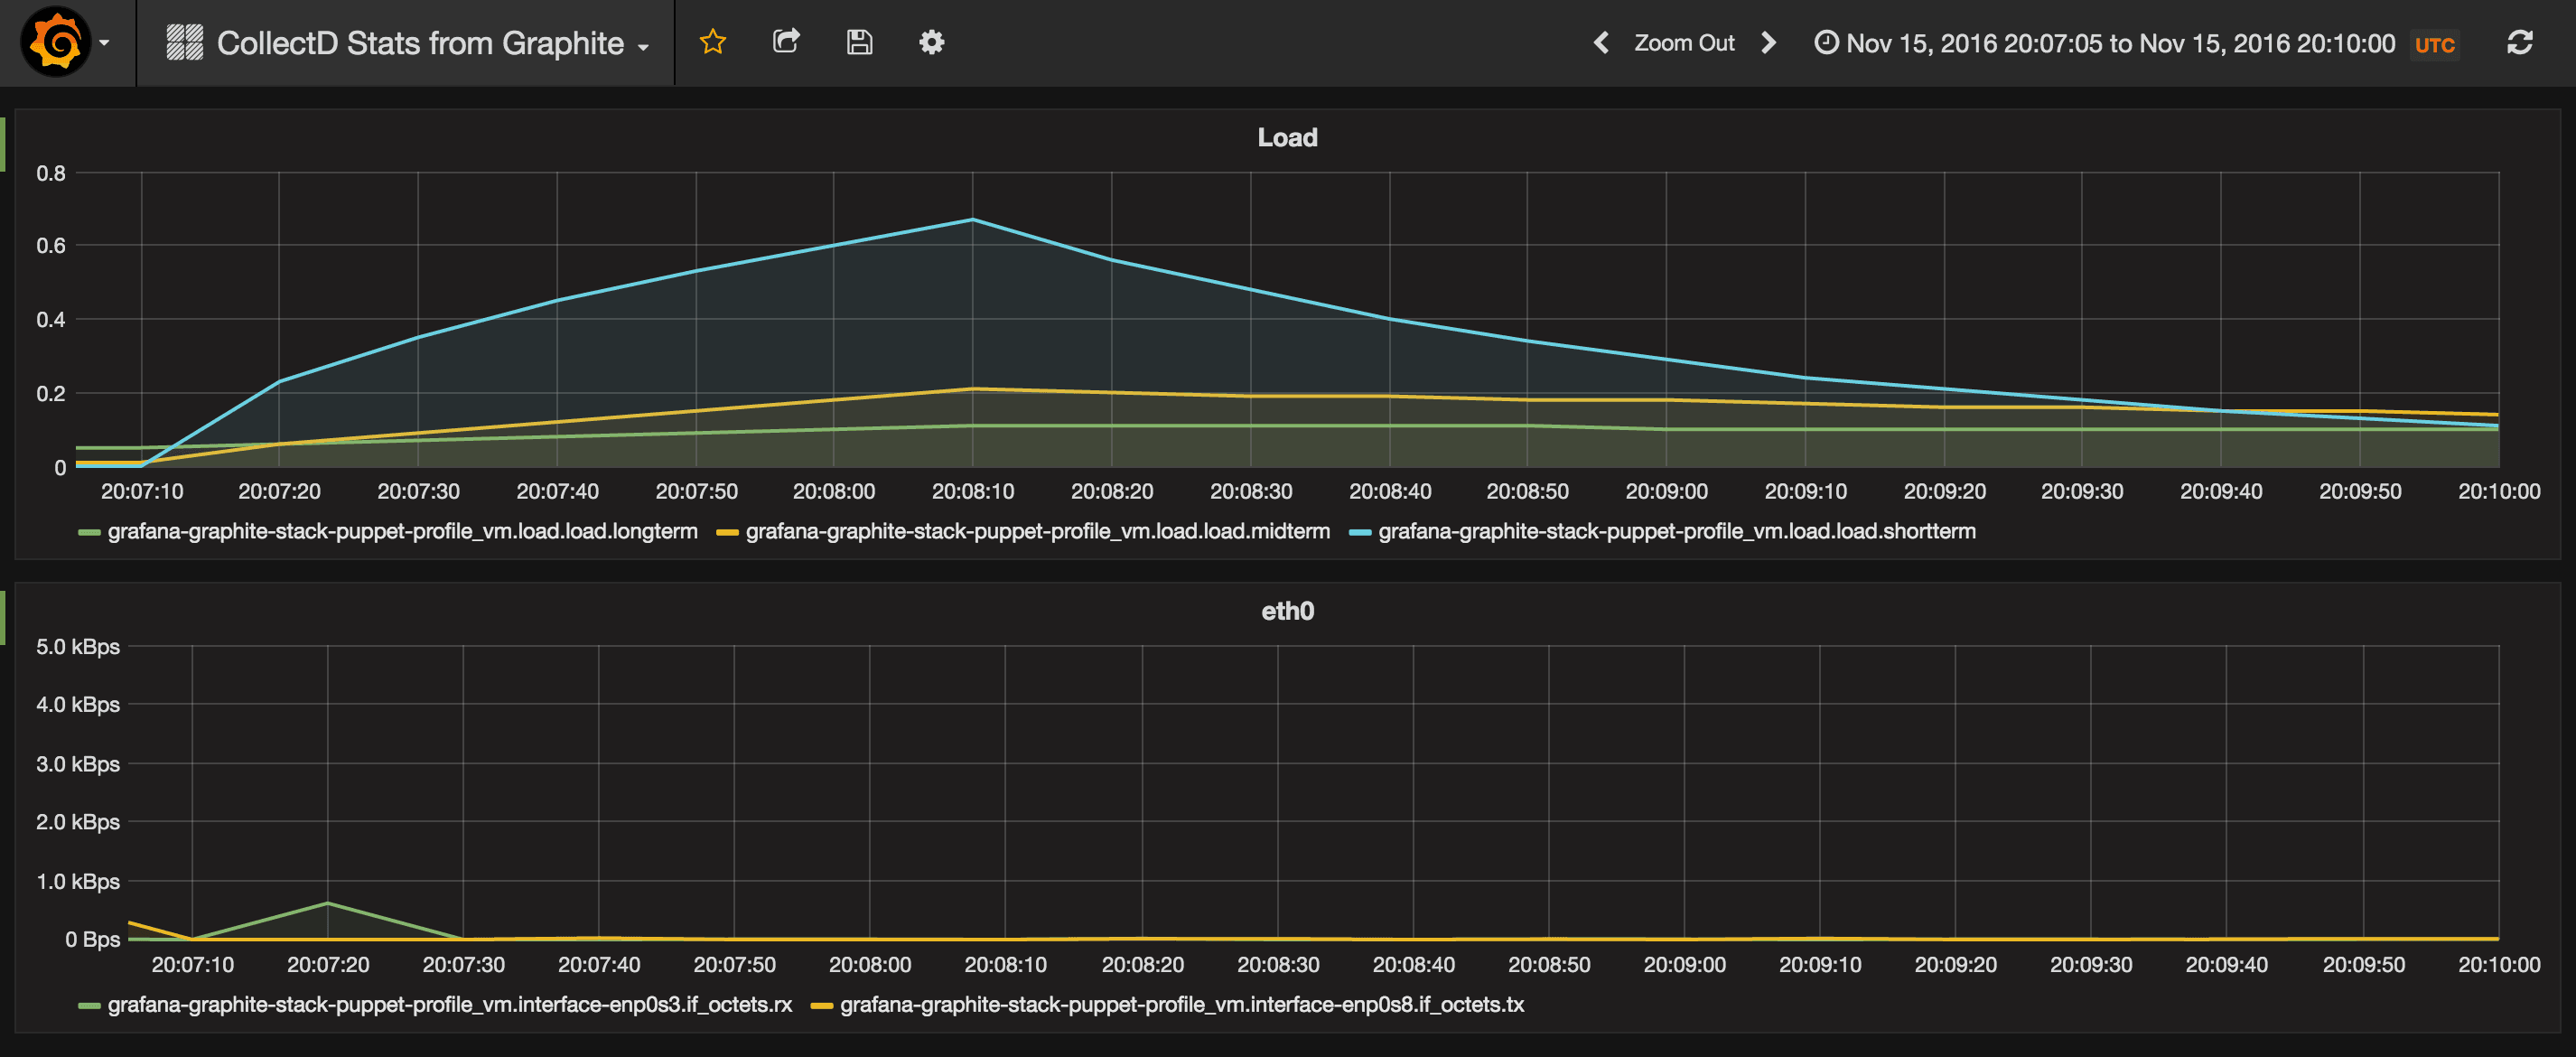
At the end of it, boom, I had my working Grafana dashboard:
=> centos7: stress: info: [11371] dispatching hogs: 1 cpu, 0 io, 0 vm, 0 hdd
==> centos7: stress: info: [11371] successful run completed in 60s
==> centos7: Download file to create network traffic
==> centos7: Running provisioner: shell...
    centos7: Running: inline script
==> centos7: Redirecting to /bin/systemctl stop  iptables.service
==> centos7: Failed to issue method call: Unit iptables.service not loaded.
==> centos7: Redirecting to /bin/systemctl stop  firewalld.service
==> centos7: Grafana is running at http://192.168.10.50:3000
==> centos7: Username and password: admin:admin

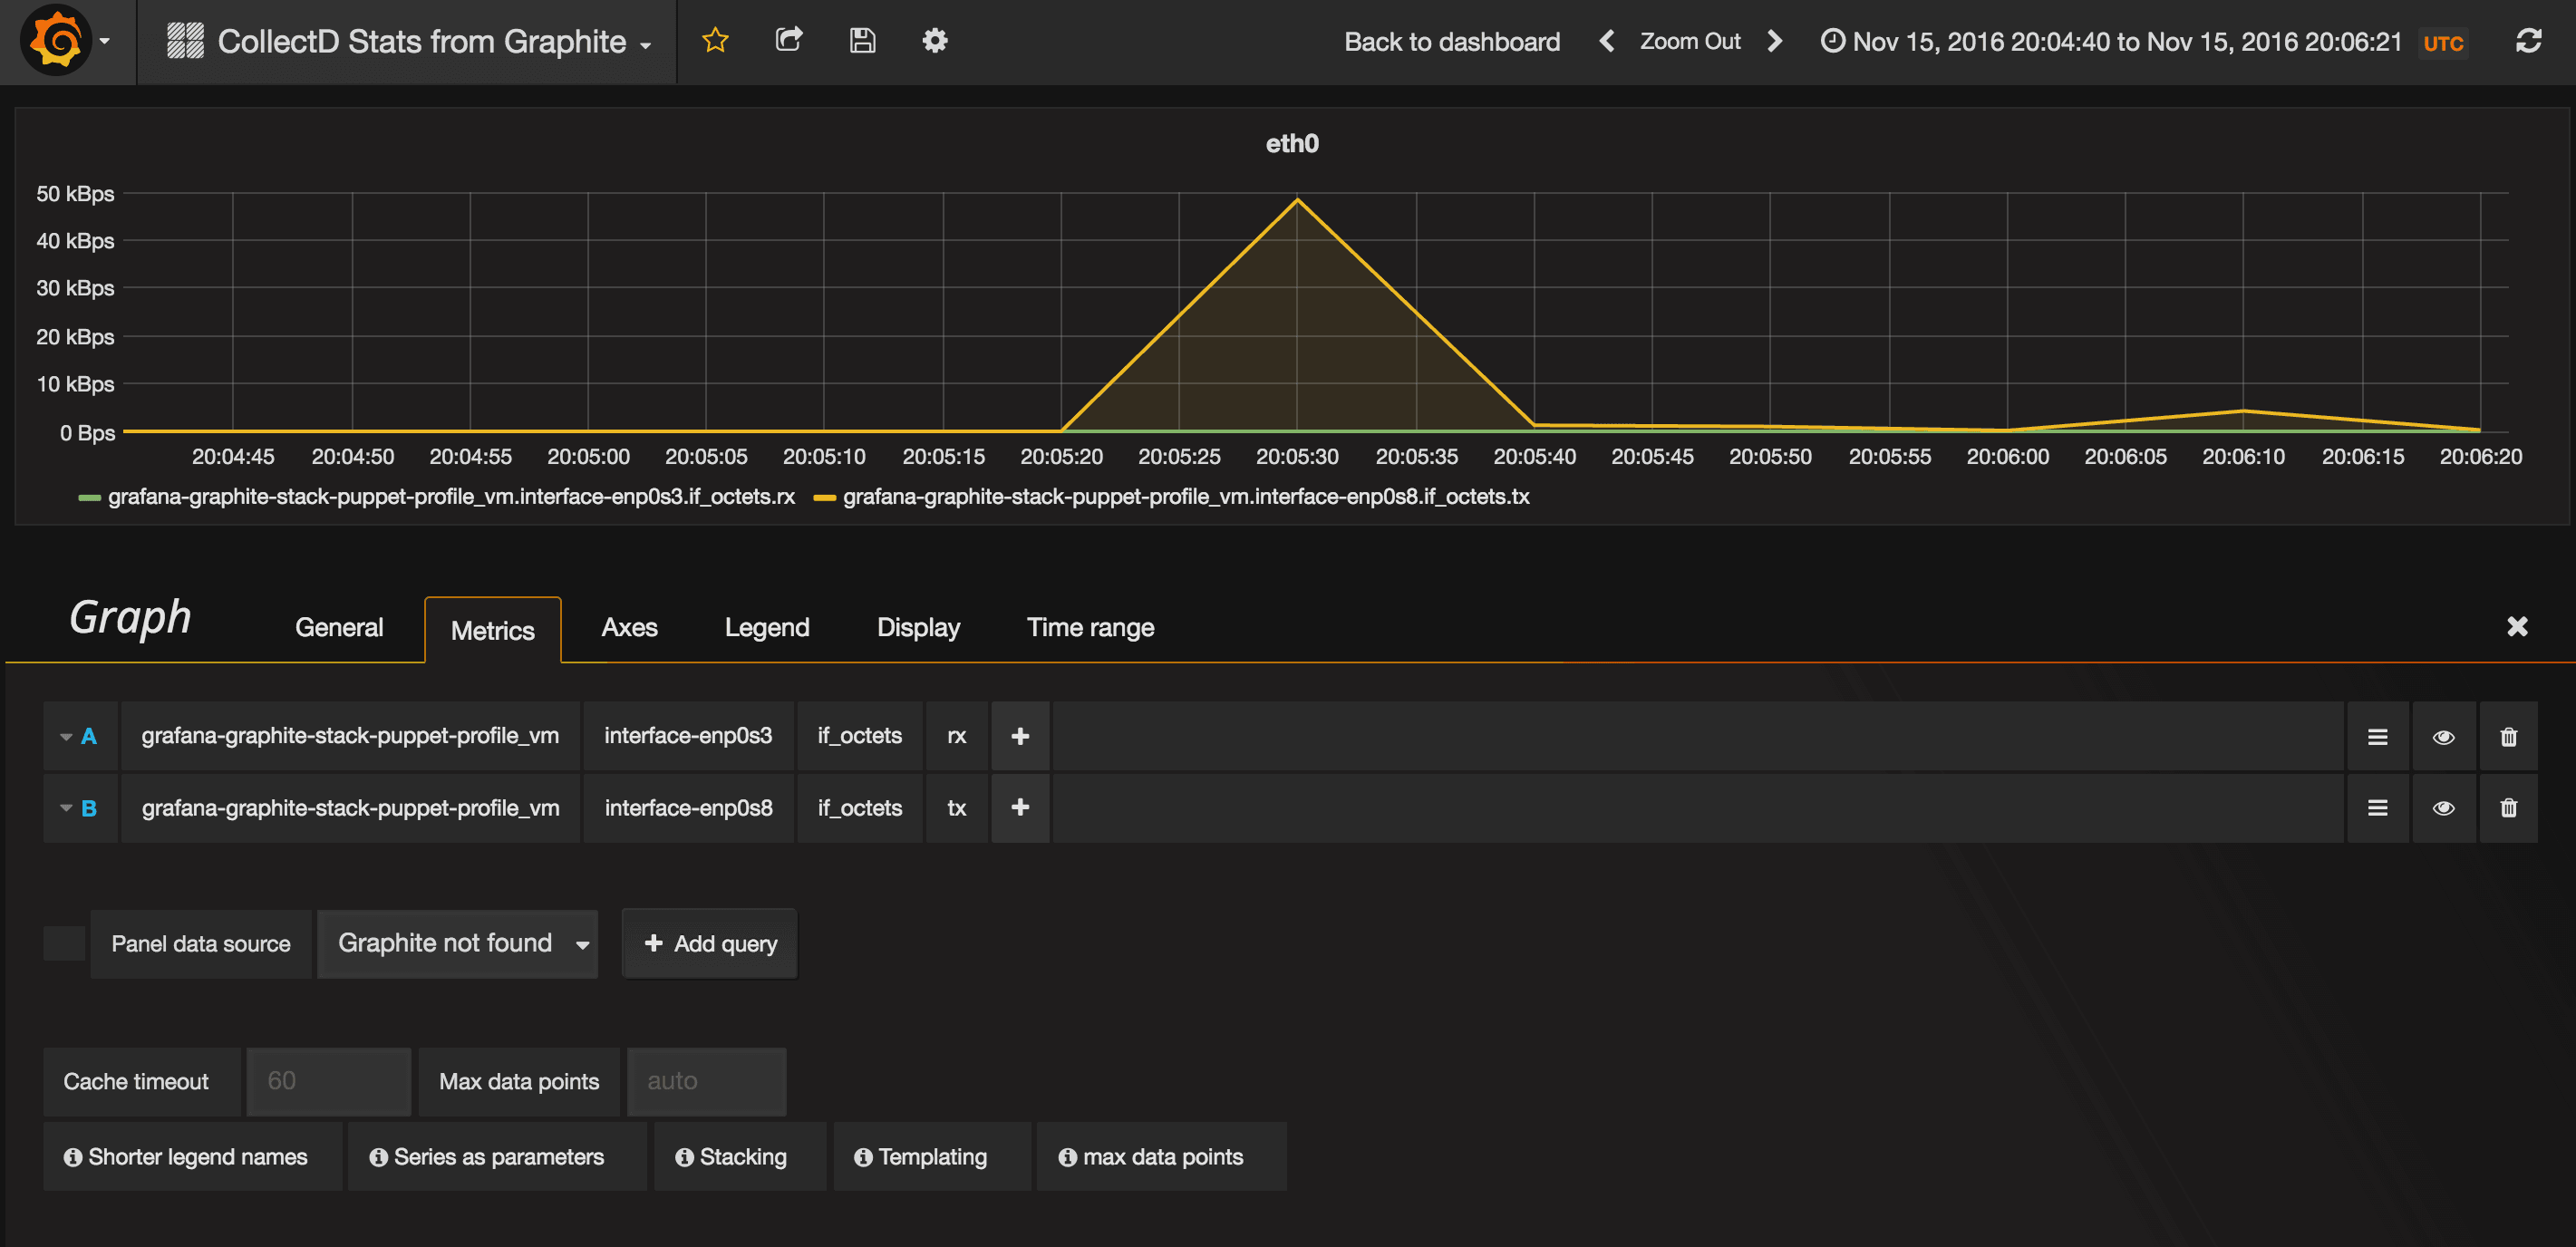
Note the bump when I ran the file download

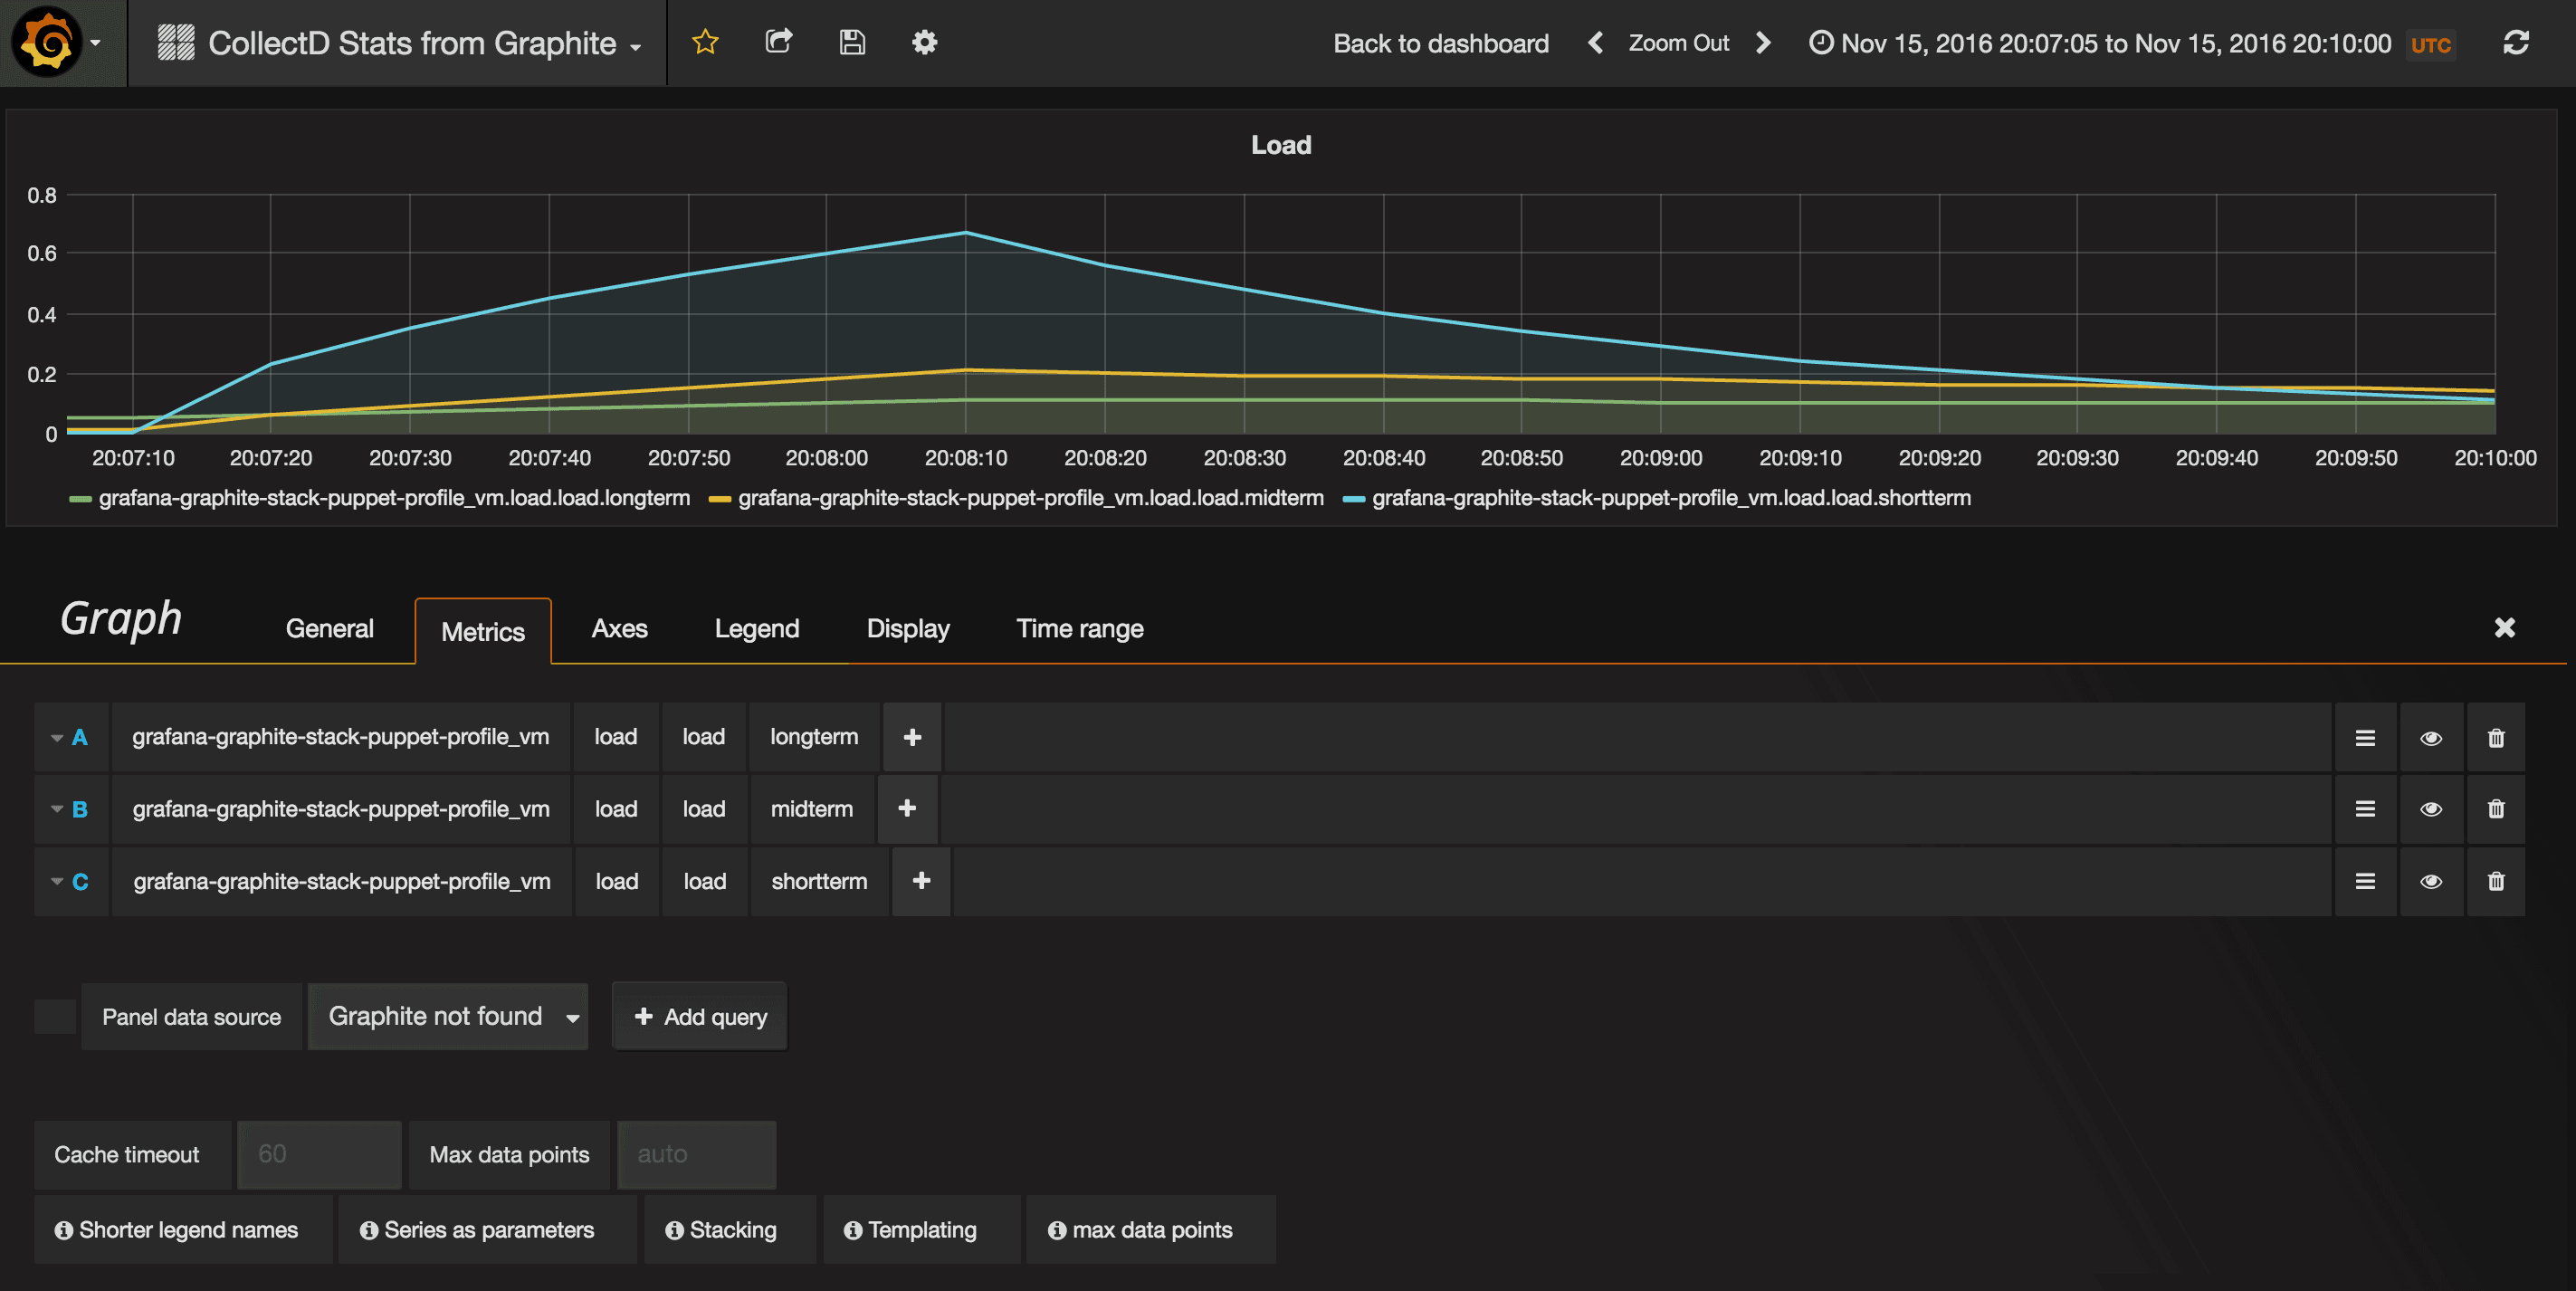
Note the jump when I ran stress
One of the things I was curious about was how Graphite scaled, as it’d been 3 years since I’d last set it up in anger.
Jason Dixon, the person behind the and general Graphite blogger extraordinaire, basically said for for most people, regular Graphite will scale for a long time with enough resources and configuration, and backed it up with some example setups:
- http://obfuscurity.com/2016/08/Benchmarking-Carbon-and-Whisper-on-AWS
- http://obfuscurity.com/2016/09/Benchmarking-Graphite-on-NVMe
Which is awesome!
Vagrant repo is available here, all you have to do is run vagrant up:
